Showing posts with label Record. Show all posts

White Paper - Redefining Value: The New Metrics of Sustainable Business

This complimentary report provides a recap of key themes and takeaways from New Metrics '12, in the form of reflections on recent lessons, leading case studies and forthcoming opportunities.

We are seeing rapid shifts in the following three areas:

1. The degree to which citizens trust business
2. The degree to which people care if any individual brand persists,
3. The degree to which society is beginning to hold business accountable for addressing many of the social and environmental challenges we face.

The metrics by which we define and measure value must change if for no other reason than to respond to these shifts.

Nothing can drive faster organizational response to a changing business environment - or facilitate realignment between corporate functions or within value networks - than a shift in the metrics used to track success.

In 2011, Sustainable Brands launched a series of conversations on this topic, both online and via the New Metrics of Sustainable Business Conference. The conference convened again in 2012, and in 2013 there will be a third installment of the annual gathering (for more information see below).

The objective at New Metrics of Sustainable Business Conference has been to bring together thought leaders from business, non-profits and academia to realize three objectives:

1. Understand the rapidly evolving progress towards developing and implementing New Metrics globally
2. Advance the state of the art through focused discussions based on case studies; and
3. Nurture the emergence of new mental models to deliver and benefit from new forms of value.

For more information on New Metrics '13, which will take place on September 24-25 in Philadelphia, click here.

To access the New Metrics complimentary white paper click here.

Related Articles
Evolving Metrics for Corporate Sustainability: Beyond Waste, Water and Energy
Is Sustainability Still Possible?
Ten Sources of Green Supply Chain Information
PPR Home's Sustainability Journey: Innovative Metrics Shed Light

We are on Track for a 6 Degree Rise in Temperature

According to a new analysis released on November 5 and reported in the Guardian, the world is on track for "at least six degrees of warming" by the end of the century. The new research was conducted by consultancy giant PwC. Their investigation concluded that we will need a "5.1 per cent annual cut in global emissions per unit of GDP, known as carbon intensity, through to 2050 if the world is to avoid the worst effects of climate change and meet an internationally agreed target of limiting average temperature increases to just two degrees above pre-industrial levels."

The growth of GHG emissions in emerging countries represent one of the biggest challenges to combating climate change. Specifically nations like China, India, Brazil, Mexico, Russia, Indonesia and Turkey, whose cumulative 7.4 percent annual increase in emissions. However emerging nations are not alone, the research indicates that industrialized countries must also accelerate their carbon reduction efforts.

The report concludes that "governments and businesses can no longer assume that a two-degree warming world is the default scenario", and urges greater planning to cope with the disruptive effects that more unpredictable and extreme weather will have on supply chains, long-term assets, and infrastructure, particularly in coastal or low-lying regions.

Meanwhile, businesses in carbon-intensive sectors must also anticipate "invasive regulation" and the possibility of stranded assets, said Jonathan Grant, director of sustainability and climate change at PwC.

"Resilience will become a watchword in the boardroom – to policy responses as well as to the climate," he said. "More radical and disruptive policy reactions in the medium term could lead to high-carbon assets being stranded.

According to National Geographic, a 6 degree rise in temperature will radically change our world.

To avert the worst effects of climate change we must imediately begin to radically reduce emissions. The focus should be on cleaner power generation, energy-efficiency, transport and industry, as well as forest preservation (REDD).

Related Articles
The Dramatic Implications of Melting Arctic Sea Ice
The Safe Upper Limit of Atmospheric Carbon is 350 PPM
Arctic Monitoring Stations Report High Levels of CO2
Melting Arctic Ice is Releasing Massive Amounts of Methane
Debunking CO2 Myths and The Science of Climate Change
Primer on CO2 and Other GHGs
The Green Economy is the Right Solution for our Troubled Times
Action on Climate Change
The Effects of Global Warming
Natural Gas is Not Clean Energy
Whats the Fracking Problem?
Coke and the WWF's CO2 Eating Billboard

Comprehensive Review of Climate Change Science

The evidence for anthropogenic global warming is unassailable. In 2009, 18 scientific groups — including the American Association for the Advancement of Science and the American Meteorological Society — issued a joint statement indicating that human activities are the “primary driver” of climate change. The National Academy of Sciences (the gold standard for objective scientific assessment) have also clearly supported the body of evidence on anthropogenic global warming.

“Some scientific conclusions or theories have been so thoroughly examined and tested, and supported by so many independent observations and results, that their likelihood of subsequently being found to be wrong is vanishingly small. Such conclusions and theories are then regarded as settled facts. This is the case for the conclusions that the Earth system is warming and that much of this warming is due to human activities."

Here are 33 articles, reports and studies that support the existence of anthropogenic climate change:
  1. No scientific body of national or international standing maintains a dissenting opinion on climate change
  2. September 2012 was the Warmest in Recorded History (NOAA)
  3. Strong Body of Evidence for a Changing Climate
  4. American Meteorological Society Corroborates Anthropogenic Climate Change
  5. More Scientific Support for Anthropogenic Climate Change
  6. Science and Pernicious Ignorance of Climate Change Denial
  7. The Fifth Global Environmental Outlook Report
  8. Findings and Solutions in the Living Planet Report 2012
  9. A New Study Indicates We Are Reaching a Tipping Points
  10. Environmental Tipping Points
  11. Climate Change Science
  12. Top Four Climate Studies of 2011
  13. State of the Climate Global Analysis Nov 2011
  14. Interactive Map Reveals Warmer Spring 2012
  15. 2012 is but the Latest Year Marked by Heat and Drought
  16. Heat in the US Northeast and Drought Around the World IN 2012
  17. Temperature Data: 1880 - 2011 (Video)
  18. New NASA Video Graphically Illustrates that the Earth is Warming
  19. Popular Media is Distorting the Facts about Climate
  20. State of the Climate Global Analysis Nov 2011
  21. Debunking CO2 Myths and The Science of Climate Change
  22. Primer on CO2 and other GHGs
  23. Video: Why People are Confused about the Scientific Veracity of Climate Change
  24. Bill McKibben: Global Warming's Terrifying New Math
  25. The Effects of Global Warming
  26. The human fingerprint in global warming
  27. Human activities produce in just 3 to 5 days, the equivalent amount of carbon that volcanoes produce globally each year
  28. Chronological history of atmospheric CO2, showing a massive spike from the Industrial Revolution onwards
  29. Strong correlation between atmospheric CO2 levels, man-made carbon emissions and the global average temperature
  30. The rapid decline in Arctic sea ice is between 70% and 95% due to man-made global warming
  31. A NASA study reports that changes in solar activity cannot be responsible for the current period of global warming 
  32. 10-year average (2000–2009) global temperature anomaly relative to 1951–1980 mean

© 2012, Richard Matthews. All rights reserved.

September 2012 was the Warmest in Recorded History

A wide range of temperature data indicate that the earth continues to get warmer. September 2012 was tied for the warmest September since the dawn of temperature records. These were the findings of the State of the Climate Global Analysis, September 2012 from the National Oceanic and Atmospheric Administration (NOAA) National Climatic Data Center.

Global Averages

The average combined global land and ocean surface temperature for September 2012 tied with 2005 as the warmest September on record, at 0.67°C (1.21°F) above the 20th century average of 15.0°C (59.0°F). Records began in 1880. The globally-averaged land surface temperature for September 2012 was the third warmest September on record, at 1.02°C (1.84°F) above average. The globally-averaged ocean surface temperature tied with 1997 as the second warmest September on record, at 0.54°C (0.97°F) above average. The average combined global land and ocean surface temperature for January–September 2012 was the eighth warmest such period on record, at 0.57°C (1.03°F) above the 20th century average.

Hungary

Following the second warmest summer (June–August) for Hungary since national records began in 1900, monthly temperatures remained above average across the entire country during September, ranging from about 1.0°–3.5°C (1.8°–6.3°F) above the 1971–2000 average, according to the country's national meteorological service, Országos Meteorológiai Szolgálat.

Australia

Australia experienced its third warmest September since records began in 1950, with the nationally-averaged maximum temperature 1.94°C (3.49°F) above the 1961–1990 average. The minimum temperature was also above average but not quite as extreme as the maximum, at 0.42°C (0.76°F) above the long-term average.

Argentina

According to Argentina's national meterological service, Servicio Meteorológico Nacional, the monthly-averaged daily, maximum, and minimum temperatures were all above normal across Argentina, particularly in the central and northern regions of the country. Record high September minimum temperatures were observed across parts of the midwest.

Japan

As indicated in the land and ocean temperature percentiles map above, Japan observed record warmth during September. According to the Japan Meteorological Agency, the greatest warmth was observed across northern Japan (regions of Hokkaido and Tohuko), which was 3.7°C (6.7°F) above average. It was below average across Okinawa, which had been impacted by Super Typhoons Sanba (middle of the month) and Jelawat (end of the month).

Related Articles
New NASA Video Graphically Illustrates that the Earth is Warming
Popular Media is Distorting the Facts about Climate
Strong Body of Evidence for a Changing Climate
American Meteorological Society Corroborates Anthropogenic Climate Change
More Scientific Support for Anthropogenic Climate Change
A New Study Indicates We Are Reaching a Tipping Points
Environmental Tipping Points
2012 is but the Latest Year Marked by Heat and Drought
Heat in the US Northeast and Drought Around the World
Strong Body of Evidence for a Warming Climate
Interactive Map Reveals Warmer Spring
Temperature Data: 1880 - 2011 (Video)
The Effects of Global Warming
Bill McKibben: Global Warming's Terrifying New Math
Extreme Weather
The Effects of Global Warming
Top Four Climate Studies of 2011
State of the Climate Global Analysis Nov 2011
Bill McKibben: Global Warming's Terrifying New Math
Extreme Weather
Extreme Weather
Extreme Weather and the Costs of Climate
Climate Change Science
The Effects of Global Warming
Top Four Climate Studies of 2011
State of the Climate Global Analysis Nov 2011
Debunking CO2 Myths and The Science of Climate Change
Primer on CO2 and other GHGs
Temperature Data: 1880 - 2011 (Video)
Video: Why People are Confused about the Scientific Veracity of Climate Change
Bill McKibben on Connect the Dots Events
Interactive Map Reveals Warmer Spring
100 Global Activities for Climate Impacts Day
The World “Connects the Dots” Between Extreme Weather & Climate Change
Business and Climate Impacts Day
Bill McKibben on Connect the Dots
Connect the Dots End Fossil Fuel
Extreme Weather
McKibben Attributes Extreme Weather Events to Climate Change
Extreme Weather Makes a Convincing Case for Climate Change
Hurricane Irene and the Staggering Costs of Climate Change
Deadly Tornadoes in Massachusetts
Extreme Weather and the Costs of Climate Change
Floods in the Philipines Underscore the Deadly Toll from Climate Change
The Costs of Global Warming
24 Hours of Reality
Science and Pernicious Ignorance of Climate Change Denial
More Scientific Support for Anthropogenic Climate Change
World Day to Combat Desertification
The Fifth Global Environmental Outlook Report

2012 is but the Latest Year Marked by Heat and Drought

With its heatwaves and drought, the summer of 2012 has been hot. In fact, the Northeast has experienced the hottest period from January to July ever recorded and July 2012 was the hottest month ever in the contiguous US. Although the weather has been balmy this year, extreme heat and drought are not anything new.

According to an EPA report, seven of the top ten warmest years on record for the continental U.S. have occurred since 1990. The frequency of heat waves have also steadily risen since the 1960’s and the percentage of the US population experiencing heat waves has also increased. Perhaps most convincing is the fact that seventeen of the warmest years in recorded history have occurred over the last twenty years and the warmest years on record occurred in the most recent decade.

The summer of 2011 was one of the hottest on record and the summer of 2010 saw record-setting temperatures in more than a dozen nations. There were record-breaking temperatures all around the world in 2010 and a new record was set for the second highest average global temperature over a 12 month period. In 2011, the U.S. experienced widespread record-breaking heat waves and droughts, which along with other extreme weather events, have been linked to climate change.

In 2010, China recorded the second highest temperatures it had ever seen, and India recorded its warmest year ever. Many heat records were also set in the U.S. in 2010. According to NASA, 2010 was tied for the hottest year ever in the U.S. and NASA’s temperature record showed that it was the hottest January to April in recorded U.S. history. In the U.S. there were more than 4000 daily high temperature records that were tied or broken in June. There were also 159 reports of record high temperatures for June and 42 reports of all-time record hottest temperatures.

The Great Russian drought of 2010 prompted fires and destroyed 25 million acres of crops. Thousands died around the globe as many parts of the world suffered under the record-breaking heat. More recently, the Amazon faced its second “hundred-year drought” in the past five years.

Even before 2010, the evidence for a warming trend was building. Researchers have been pointing to a link between weather and climate for decades. Eight years ago, a study published in NatureNews indicated that global warming was partially responsible for the deadly heat wave that scorched Europe in 2003. Hurricane Irene pushed the U.S. yearly record for billion-dollar natural disasters to 10 in 2011, smashing the 2008 record of nine.

The extreme heat and drought we are experiencing in 2012 looks increasingly like the years that preceded it. We may very well be dealing with global weather patterns that have been permanently changed by global warming.

© 2012, Richard Matthews. All rights reserved.

Related Posts
The Heat and Drought of 2012
Bill McKibben: Global Warming's Terrifying New Math
Extreme Weather
Extreme Weather and the Costs of Climate
Climate Change Science
The Effects of Global Warming
Top Four Climate Studies of 2011
State of the Climate Global Analysis Nov 2011
Debunking CO2 Myths and The Science of Climate Change
Primer on CO2 and other GHGs
Temperature Data: 1880 - 2011 (Video)
Video: Why People are Confused about the Scientific Veracity of Climate Change
Bill McKibben on Connect the Dots Events
Interactive Map Reveals Warmer Spring
100 Global Activities for Climate Impacts Day
The World “Connects the Dots” Between Extreme Weather & Climate Change
Business and Climate Impacts Day
Bill McKibben on Connect the Dots
Connect the Dots End Fossil Fuel
Extreme Weather
McKibben Attributes Extreme Weather Events to Climate Change
Extreme Weather Makes a Convincing Case for Climate Change
Hurricane Irene and the Staggering Costs of Climate Change
Deadly Tornadoes in Massachusetts
Tornadoes and Floods Underscore the Costs of Global Warming
Extreme Weather and the Costs of Climate Change
State of the Climate Global Analysis Nov 2011
Floods in the Philipines Underscore the Deadly Toll from Climate Change
The Costs of Global Warming
24 Hours of Reality
Science and Pernicious Ignorance of Climate Change Denial
More Scientific Support for Anthropogenic Climate Change
World Day to Combat Desertification
The Fifth Global Environmental Outlook Report

Heat in the US Northeast and Drought Around the World

Against a backdrop of wildfires and droughts, heat records are being broken across the US but nowhere more than in the Northeast. After a winter with very little snow, people in the Northeast have been subjected to record breaking heat for the first seven months of 2012. The period between July 2011 to July 2012 was also the warmest 12-months in the Northeast ever recorded. The weather is making headlines across the nation with more than half of the country suffering from high temperatures and little rain. The drought is driving up the cost of agricultural commodities and contributing to price volatility, they may even lead to a food crisis. Although it is abnormally dry in the Northeast, they have escaped drought conditions, what they cannot escape is heat.

The Northeast Regional Climate Center at Cornell University reported that July 2012 was the hottest month on record for the contiguous US. The Northeast had the warmest January through July on record. The average temperature in the 12-state region during this period was 49.9 degrees.

All throughout the Northeast there have been single day record breaking heat in July. The climate center reported that in July Washington's Reagan National Airport hit 105 degrees, Baltimore and Newark recorded 104 degrees, Syracuse hit 101, and New York City's LaGuardia Airport also saw temperatures of 101 degrees.

The US is not the only nation suffering from drought, extreme dry spells in China, Africa, Russia, Australia and Western Europe may be suggestive of a permanent change in climate patterns.

Last year was no better, as the summer of 2011 was marked by record heat and drought. Russia lost 13.3 million acres of crops, or about 17 percent of its production. Also in 2011, drought was so severe in the Horn of Africa that it killed 60 percent of Ethiopia’s cattle and 40 percent of its sheep.

If it were not for last year and the year before, this year could be easily dismissed as an anomaly. When you have consistent warming and a string of record breaking years for heat and drought all occurring in the last decade, it looks increasing like this represents a disturbing trend that is here to stay.

© 2012, Richard Matthews. All rights reserved.

Related Posts
2012 is but the Latest Year Marked by Heat and Drought
Bill McKibben: Global Warming's Terrifying New Math
Extreme Weather
Extreme Weather and the Costs of Climate
Climate Change Science
The Effects of Global Warming
Top Four Climate Studies of 2011
State of the Climate Global Analysis Nov 2011
Debunking CO2 Myths and The Science of Climate Change
Primer on CO2 and other GHGs
Temperature Data: 1880 - 2011 (Video)
Video: Why People are Confused about the Scientific Veracity of Climate Change
Bill McKibben on Connect the Dots Events
Interactive Map Reveals Warmer Spring
100 Global Activities for Climate Impacts Day
The World “Connects the Dots” Between Extreme Weather & Climate Change
Business and Climate Impacts Day
Bill McKibben on Connect the Dots
Connect the Dots End Fossil Fuel
Extreme Weather
McKibben Attributes Extreme Weather Events to Climate Change
Extreme Weather Makes a Convincing Case for Climate Change
Hurricane Irene and the Staggering Costs of Climate Change
Deadly Tornadoes in Massachusetts
Tornadoes and Floods Underscore the Costs of Global Warming
Extreme Weather and the Costs of Climate Change
State of the Climate Global Analysis Nov 2011
Floods in the Philipines Underscore the Deadly Toll from Climate Change
The Costs of Global Warming
24 Hours of Reality
Science and Pernicious Ignorance of Climate Change Denial
More Scientific Support for Anthropogenic Climate Change
World Day to Combat Desertification
The Fifth Global Environmental Outlook Report

Video: Lightening Electric Motorcycle Goes Over 200 mph for 18 Cents


Here is a motorcycle that proves you can have radical efficiency and extraordinary performance. In this video you will see just how fast the Lightening electric motorcyle can go (apparently the previous run was even faster at 218.6 mph). This is the first electric motorcycle to go over 200 mph. The black and orange markers on the sides of the track fly by even though they are 1/4 mile apart.

What is most remarkable about this bike is the fact that they used only 18 cents of electricity on this run and were getting the equivalent of over 50 mpg at over 200 mph. The amount of energy in the batteries would allow over 100 miles of range at normal highway speeds and cost about one dollar.

Lightning Motorcycles is the brainchild of Richard Hatfield and a group of Silicon Valley engineers dedicated to the belief that world class performance is compatible with clean tech transportation. At Lightning Motorcycles they believe that choosing to ride an electric motorcycle should not be a compromise. They have honed our understanding of vehicle development as lifetime racers. They seek out competition to refine their technology. The Lightning SuperBike is equally suited to track days, weekend rides on your favorite back roads, or record runs at Bonneville.

In addition to the SuperBike Lightning is producing prototypes of electric commuter bikes, scooters and ATVs.

© 2012, Richard Matthews. All rights reserved.

State of the Climate Global Analysis Nov 2011


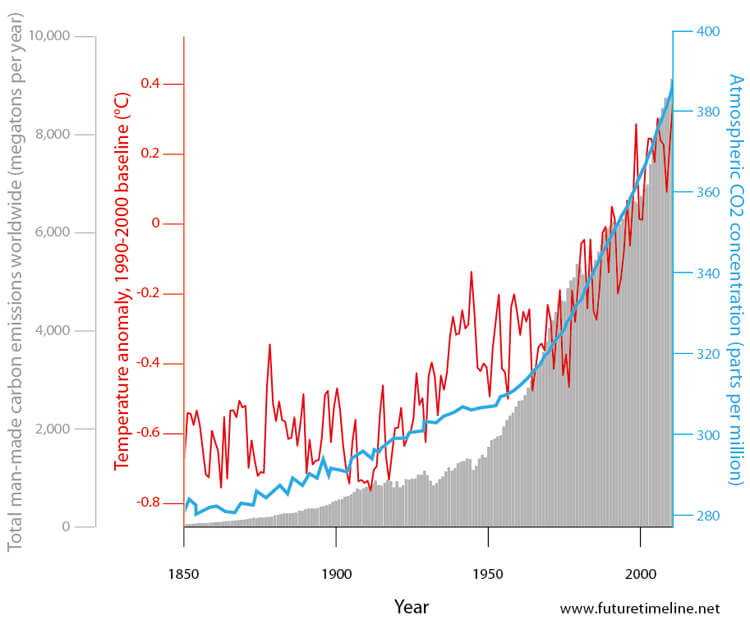
Anyone who remains unconvinced of the veracity of climate change need only review the National Oceanic and Atmospheric Administration's (NOAA) State of the Climate Global Analysis for November 2011.

According to NOAA data, 2010 is tied with 2005 as the warmest year in 131 years of global land and sea temperatures and 2011 is the 12th warmest year on record.

Global Highlights
  • The combined global land and ocean average surface temperature for November 2011 was the 12th warmest on record at 13.35°C (55.81°F), which is 0.45°C (0.81°F) above the 20th century average of 12.9°C (55.0°F). The margin of error is +/- 0.07°C (0.13°F).
  • Separately, the global land surface temperature was 0.61°C (1.10°F) above the 20th century average of 5.9°C (42.6°F), making this the 16th warmest November on record. The margin of error is +/- 0.11°C (0.20°F).
  • Warmer-than-average conditions occurred across central and eastern North America, Northern and Western Europe, northern Russia, most of China and the Middle East, southeastern Australia, and southern South America.
  • Cooler-than-average regions included Alaska, western Canada, much of Eastern Europe, Kazakhstan, and southwestern Russia.

Separately, the global land surface temperature was 0.61°C (1.10°F) above the 20th century average of 5.9°C (42.6°F), making this the 16th warmest November on record. The margin of error is +/- 0.11°C (0.20°F).

The November global ocean surface temperature was 0.39°C (0.70°F) above the 20th century average of 15.8°C (60.4°F), making it the 12th warmest November on record. The margin of error is +/- 0.04°C (0.07°F). The warmth was most pronounced across the north central and northwest Pacific, the Labrador Sea, and portions of the mid-latitude Southern oceans..

The November global ocean surface temperature was 0.39°C (0.70°F) above the 20th century average of 15.8°C (60.4°F), making it the 12th warmest November on record. The margin of error is +/- 0.04°C (0.07°F).

The combined global land and ocean average surface temperature for the September – November period was 0.52°C (0.94°F) above the 20th century average of 14.0°C (57.1°F), making it the 12th warmest such period on record. The margin of error is +/- 0.09°C (0.16°F.

The September – November worldwide land surface temperature was 0.87°C (1.57°F) above the 20th century average, the seventh warmest such period on record. The margin of error is +/- 0.17°C (0.31°F).
The global ocean surface temperature for September – November was 0.39°C (0.70°F) above the 20th century average and was the 12th warmest such period on record. The margin of error is +/- 0.04°C (0.07°F).

The combined global land and ocean average surface temperature for the January – November period was 0.52°C (0.94°F) above the 20th century average of 14.0°C (57.2°F), making it the 11th warmest such period on record. The margin of error is +/- 0.09°C (0.16°F).

The January – November worldwide land surface temperature was 0.84°C (1.51°F) above the 20th century average — the seventh warmest such period on record. The margin of error is +/- 0.20°C (0.36°F).
The global ocean surface temperature for the year to date was 0.41°C (0.74°F) above the 20th century average and was the 11th warmest such period on record. The margin of error is +/- 0.04°C (0.07°F).

The climate phenomenon La Niña continued through November, which helped produce cooler—although still above-average—temperatures on a global scale compared with previous months. The average temperature over land was 0.61°C (1.10°F) above the 20th century average. This marks the coolest monthly average temperature anomaly over land since February 2011 and the coolest November land temperature since 2000. However, it was the 16th warmest November since records began in 1880. Regionally, warmer-than-average conditions occurred across central and eastern North America, Northern and Western Europe, northern Russia, most of China and the Middle East, southeastern Australia, and southern South America.

The November average monthly temperature in Norway was 4.6°C (8.3°F) above average, making this month the country's warmest November since records began in 1900. The average temperature for Northern Norway was 5.3°C (9.5°F) above normal, also a new November record.

According to the UK Met Office, November 2011 was the second warmest November on record for the United Kingdom, Behind 1994, at 2.9°C (5.2°F) above normal. Provisionally, Scotland recorded its warmest November on record.

In Asia, China reported its third warmest November since national records began in 1951, according to the Beijing Climate Center. It was the warmest November on record in 12 provinces and second warmest in four provinces.

Cooler-than-average regions around the globe included Alaska, western Canada, much of Eastern Europe, Kazakhstan, and southwestern Russia. Alaska reported its sixth coolest November on record.

Land tends to absorb and release heat much faster than water. Thus, land temperatures generally fluctuate more rapidly than ocean surface temperatures and this is well illustrated by the global anomaly differences between October and November 2011. While the November land surface temperature anomaly was 0.61°C (1.10°F) and 16th warmest November on record, the October 2011 land temperature was 1.10°C (1.98°F) above average and was the second warmest October on record—a difference of 0.49°C (0.88°F). On the other hand, both the October and November global ocean temperature anomalies were 0.39°C (0.70°F), ranking 11th and 12th warmest for their respective months. In fact, the global monthly ocean temperature anomaly has remained between 0.35°C (0.63°F) and 0.47°C (0.85°F) during all of 2011 to date—a range of only 0.12°C (0.22°F).

La Niña conditions during November kept east central Pacific Ocean surface waters nearly 1°C below average for that region. Sea surface temperatures were also below average in the southern Atlantic Ocean and other parts of the mid-latitude southern oceans. It was notably warmer-than-average across the north central and north west Pacific Ocean, the Labrador Sea, and the southern Indian Ocean. As stated above, the globally averaged ocean temperature was the 12th warmest November on record, but was the coolest November since 2007. According to NOAA's Climate Prediction Center (CPC), La Niña is expected to peak during December 2011–January 2012 and continue through the Northern Hemisphere spring 2012.

Combining the monthly global land and ocean temperatures, November ranked as the 12th warmest November since records began, at 0.45°C (0.81°F) above average, making this the 26th consecutive November and 321st consecutive month with a global temperature above the 20th century average. The last month with below-average temperatures was February 1985. However, November 2011 also marks the coolest November since 2000 and the lowest above-average monthly temperature since February 2011.

La Niña conditions were present during all three Northern Hemisphere autumn (Southern Hemisphere spring) months. Over land, temperatures were notably above normal across most of the Northern Hemisphere higher latitudes, including most of Canada, Northern Europe, and most of Russia. It was cooler than normal in much of the Middle East and part of eastern Russia. The November land temperature was 0.88°C (1.58°F) above average, making this the seventh warmest global land November on record.

Norway recorded its warmest autumn since records began in 1900. The average temperature was 3.0°C (5.4°F) above average, topping the previous record set in 2000 of 2.8°C (5.0°F) above average. It was also Finland's warmest autumn since 1938.

It was the second warmest autumn on record for the United Kingdom in more than a century, with temperatures 2.1°C (3.8°F) above average. November 2006 was the warmest at 2.3°C (4.1°F) above average. In Central England, autumn temperatures were the second warmest in at least 350 years.

While the nationally averaged November temperature for Austria was only about 1°C above normal, the average temperature at high elevation stations was 2.6°C above average, giving this region the second warmest November in the country's 161-year period of record. The warmest autumn in the high-elevation alpine regions occurred in 2006, with temperatures 3.2°C above average, according to Zentralanstalt für Meteorologie und Geodynamik (ZAMG), Austria's National Meteorological Service.

It was the 12th warmest September–November across the global oceans. Sea surface temperatures were warmer than average across the north central and north west Pacific Ocean and parts of the mid-latitude southern oceans. Ocean temperatures were cooler than average in the east central Pacific Ocean, where La Niña conditions were observed, as well as the north east Pacific, the southern Atlantic Ocean, and parts of the mid-latitude southern oceans.

The combined global land and ocean surface temperature for September–November was the 11th warmest such period on record and the coolest since 2007, at 0.53°C (0.95°F) above the 20th century average.

La Niña conditions were present in the east central Pacific Ocean during 2011 to date, with the exception of April through July, when ENSO-neutral conditions prevailed. The January–November 2011 global combined land and ocean temperature anomaly of 0.53°C (0.95°F) was the 11th warmest such period on record but the coolest since 2008 (0.50°C / 0.90°F), which was also a La Niña year. Separately, the January–November global land and global ocean temperatures ranked as the 7th and 11th warmest such periods, respectively.

Much of Europe experienced extreme dryness during November. Germany reported its driest November since records began in 1881, measuring just 61 percent of its average monthly rainfall. Several locations recorded no measureable rainfall. Austria also had its driest November since national records began in 1858, with just 2 percent of average rainfall for the month. The second driest November was recorded in 1920, with 14 percent of average monthly rainfall.

Much-wetter-than-normal conditions occurred across parts of South Asia and northeast Africa. Tropical Depression Keila brought very heavy precipitation to the Arabian Peninsula at the beginning of the month. November rainfall across China was, on average, 57 percent above normal, marking the wettest November since 1983 for the country. It was the wettest November on record for the provinces of Shanxi, Shaanxi, Gansu, Ningxia, and Fujian.

The areas with the wettest anomalies during September–November (Northern Hemisphere fall; Southern Hemisphere spring) included part of southwestern Asia and the Middle East, northern China, and western Australia. The driest anomalies during this period were observed over much of Europe, the central United States, part of northeast Asia, and east central Australia.

The United Kingdom saw large variations in precipitation during autumn. According to the UK Met Office, it was the second wettest September–November on record in Northern Ireland. In contrast, it was the driest such period since 1978 in the Midlands, and the driest since 1985 in East Anglia and southeast England.

© 2011, Richard Matthews. All rights reserved.